Training and credentials matrix
One filterable view of who is trained and certified, moved into Analytics so managers can see whether workers are ready.
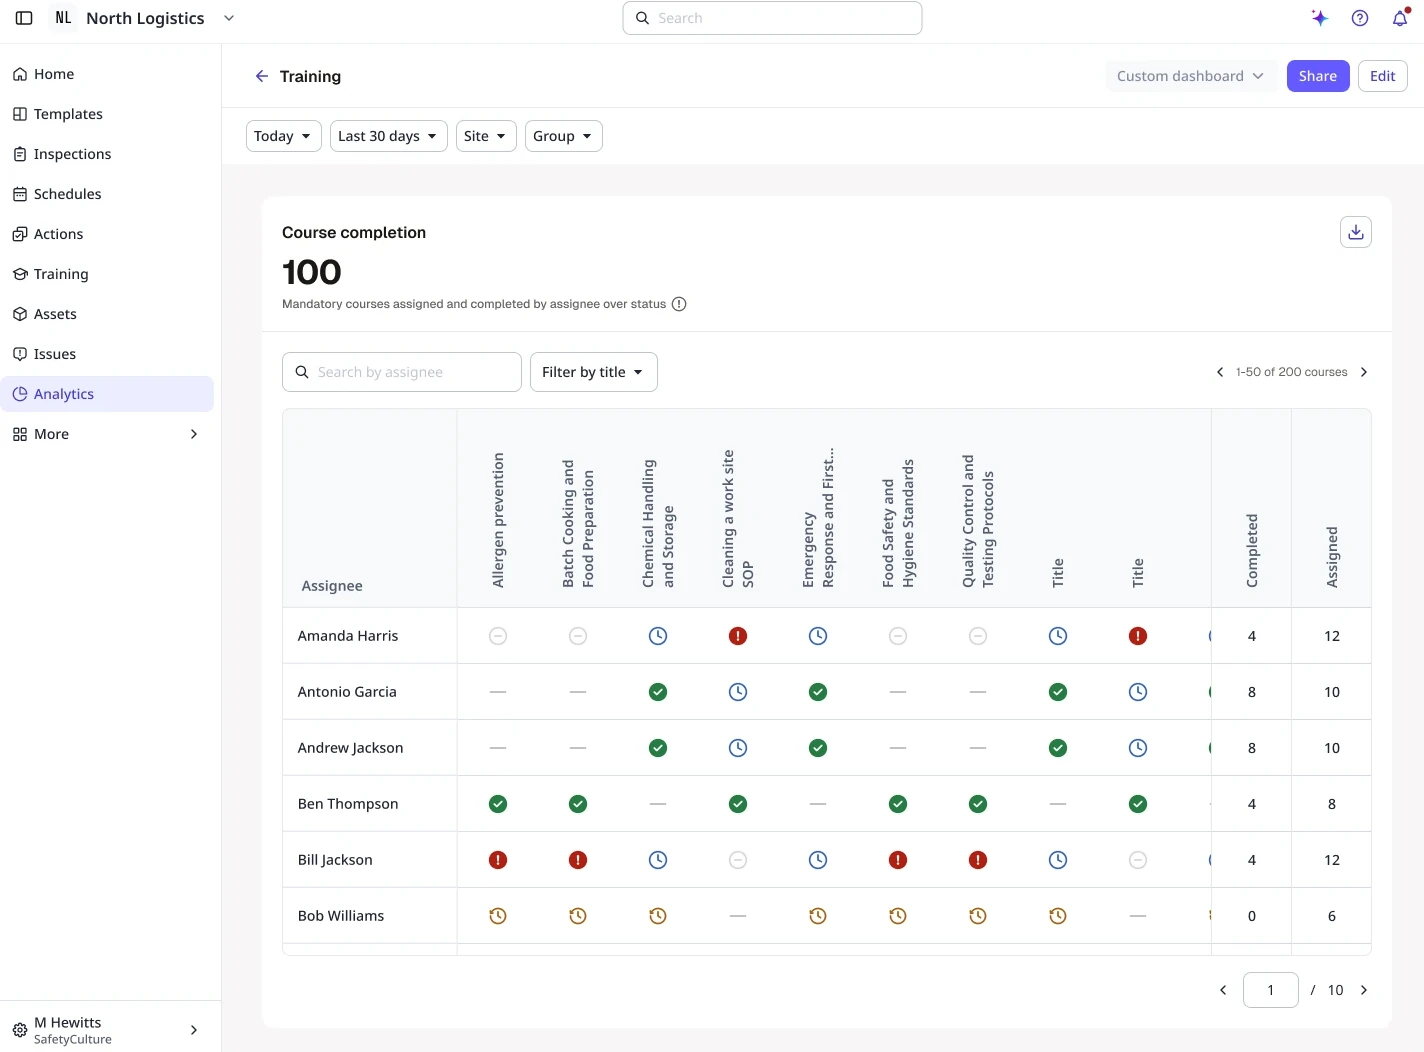
- Problem
- Managers couldn’t see in one place whether their people were trained and certified to work.
- My part
- Led design of the matrix chart, drill-down and dashboard template, and moved it into Analytics where managers already look.
- Outcome
- Weekly viewers of the training matrix doubled to 600+, and over 4,100 people a month use the credentials matrix.
01Why
Customers couldn't see, in one place, whether workers were trained and certified.
A site manager is putting together this week’s roster. Before they put someone on a machine, they need to know that person has finished their training and holds a current licence. To find out, they checked training in one place and credentials in another, or asked an admin, and even then the old matrix could be up to two hours out of date. Compliance reporting, gap analysis and rostering were all slow and error-prone, with missed expirations, repetitive manual tracking and delays whenever nobody was sure who was qualified.
02Who it’s for
The admin needs the whole picture. The manager needs this week’s shift.
The admin and the site manager open the same matrix for different reasons. The admin looks across the whole organisation. They run the compliance reports and set up the dashboards, and until now they were also who managers asked when they couldn’t find an answer. The site manager looks at their own team, usually on roster day, and needs to see at a glance who’s trained and certified to work this week. The catch was access: managers often aren’t members of the site they manage, so Analytics’ usual access rules locked them out. Letting access follow who reports to whom meant getting three teams behind one change.
03Options
Separate charts first, one combined view later.
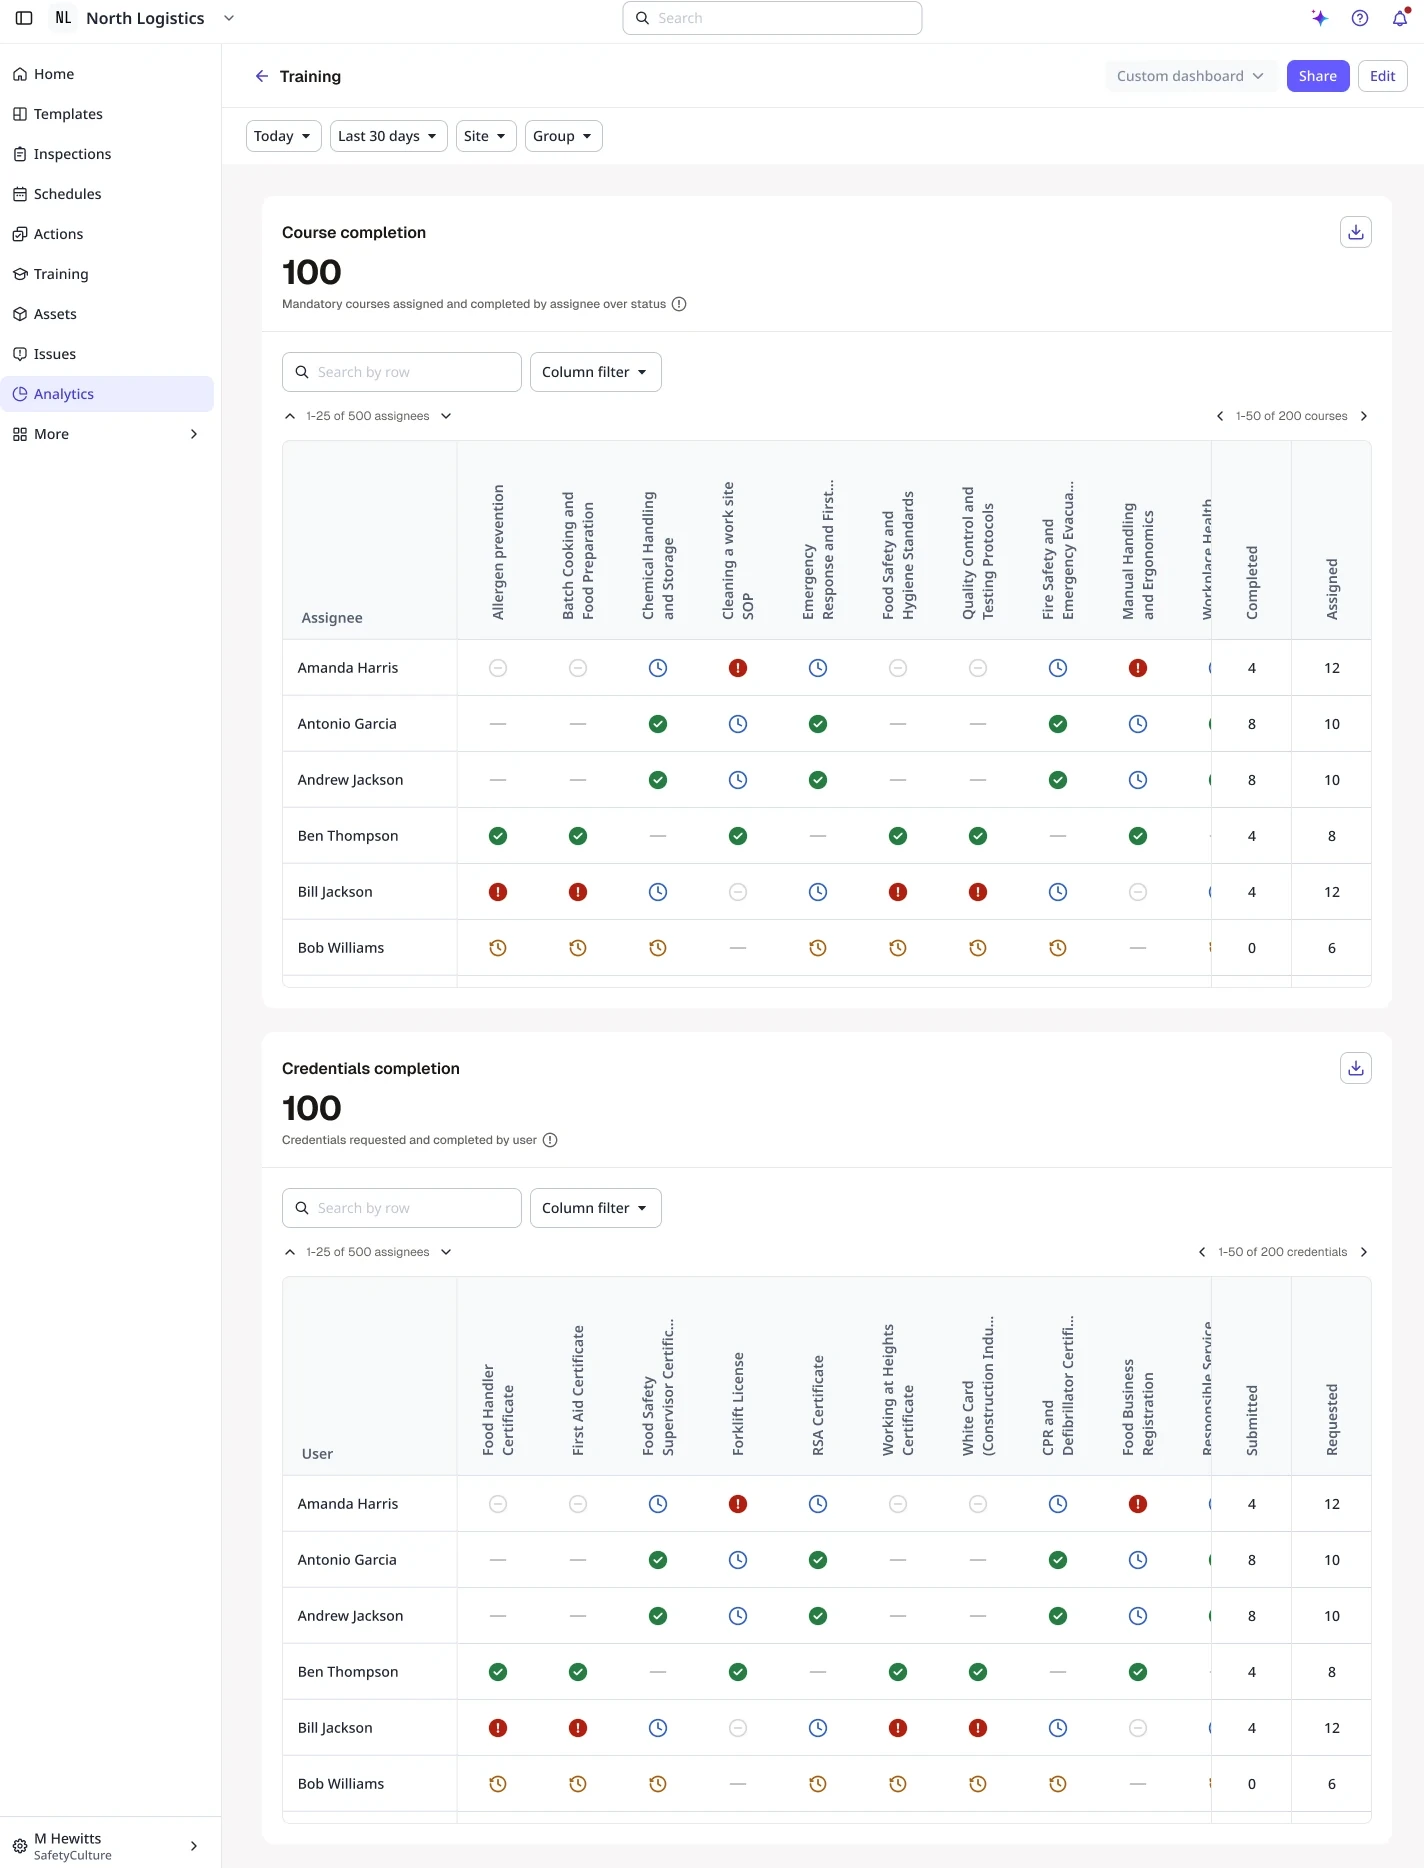
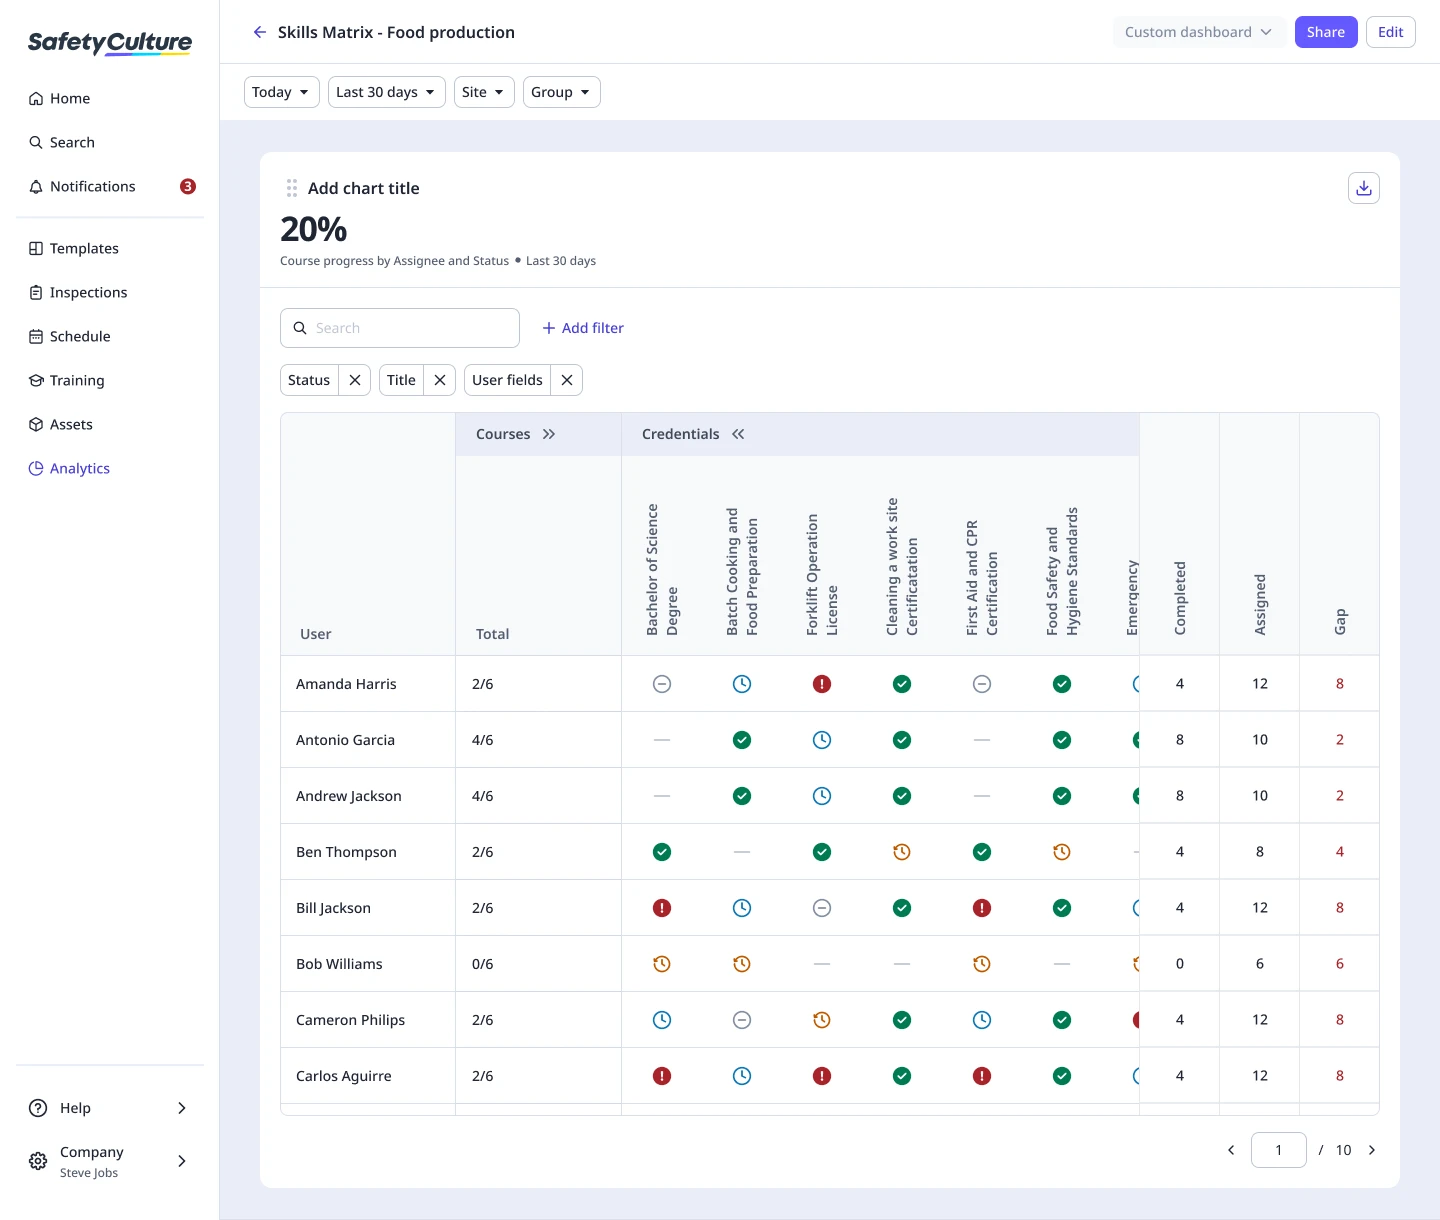
Rather than one combined view straight away, we shipped the training matrix first, with a drill-down and filters, then a credentials matrix, and kept a single combined view for later. We also moved it from Training into Analytics, where managers already looked for their people.
04What we built
A matrix chart that can be used in any customisable dashboard.
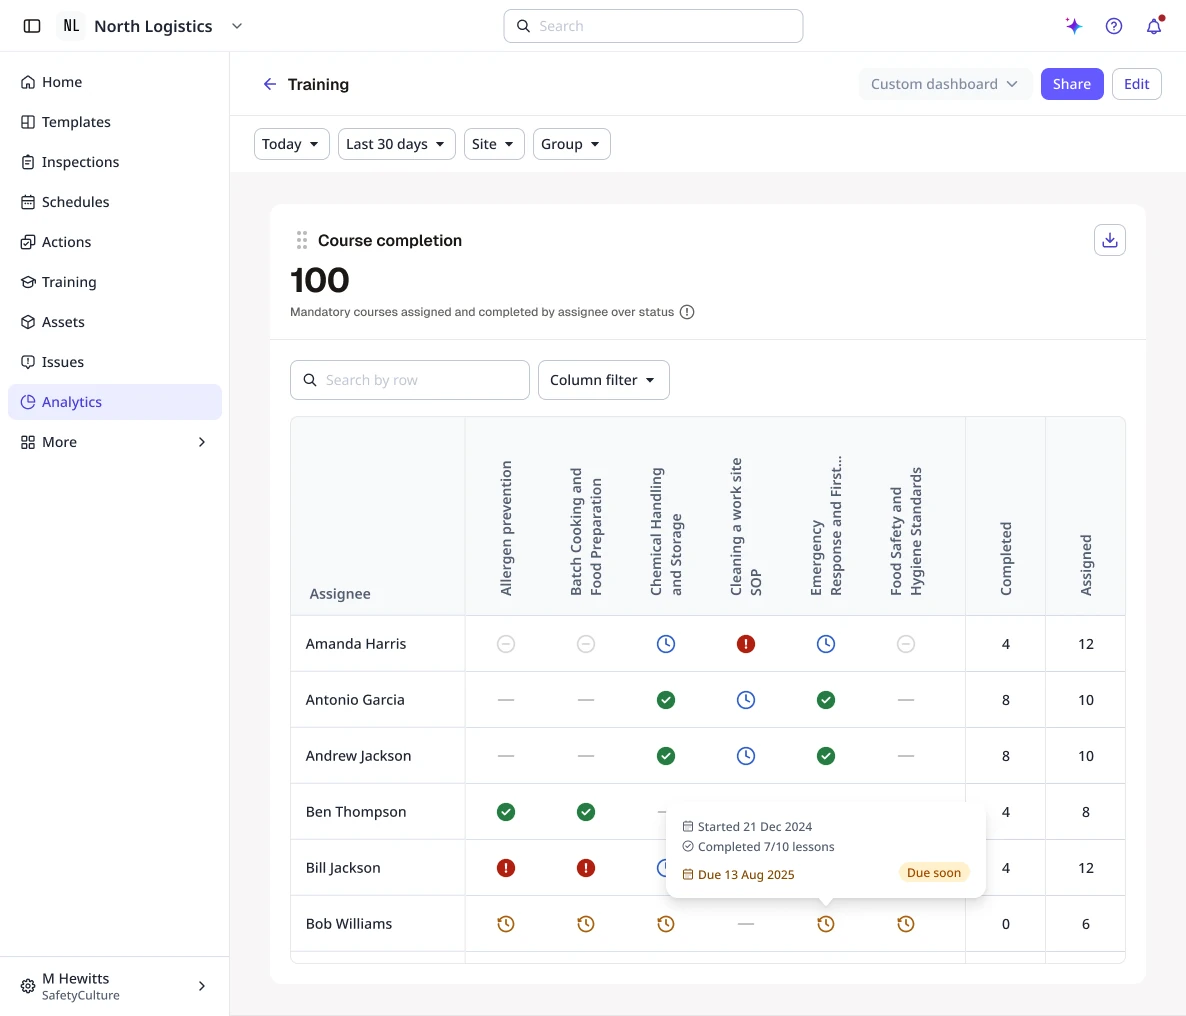
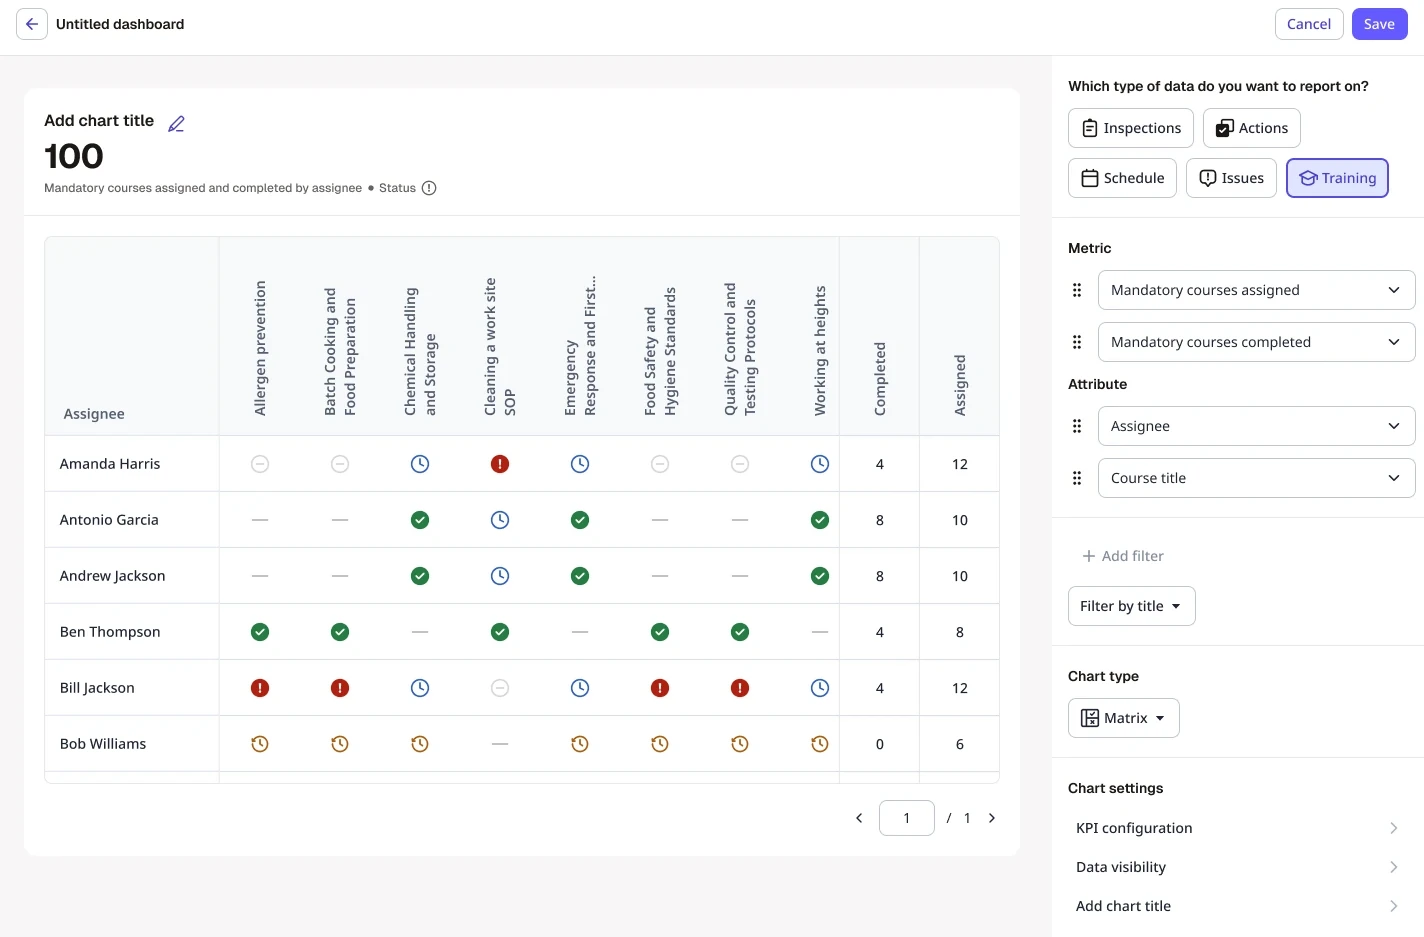
For the site manager, the matrix shows only what matters: mandatory courses by default, with inactive or unassigned users filtered out, so the grid shows the people who actually need the training. Every cell tells them where someone stands, from not started and in progress to due soon or overdue, and selecting a cell or a person opens a side sheet with the detail behind it, down to each lesson. They can flip the grid to read by course instead of by person, and export the filtered view as a CSV for compliance. Most managers land on a pre-built Training dashboard; admins can add the matrix to their own dashboards as a chart or from a new template.
05How it works
A manager narrows the matrix to their team; an admin sets up the chart.
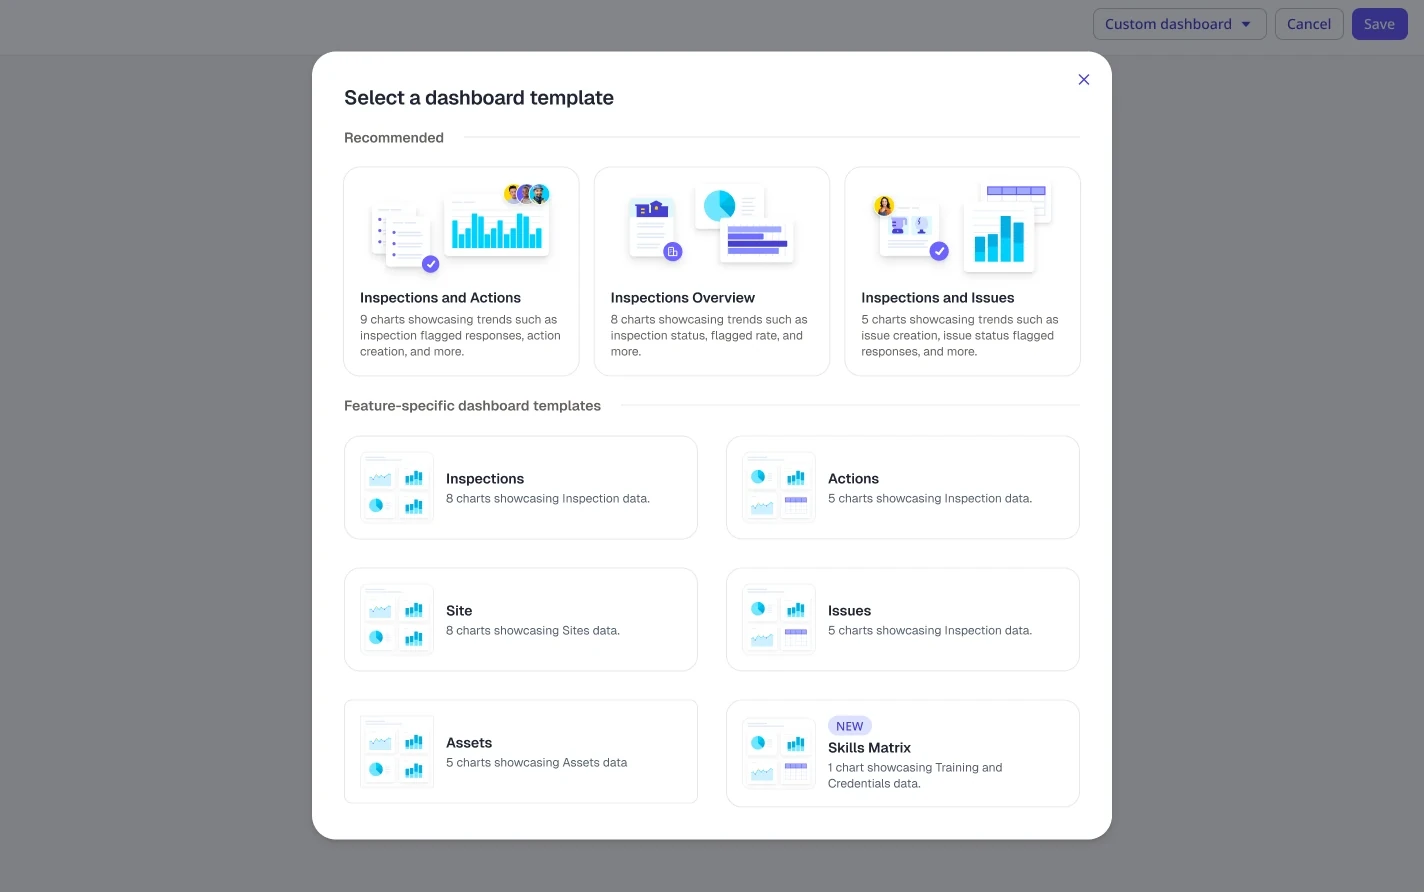
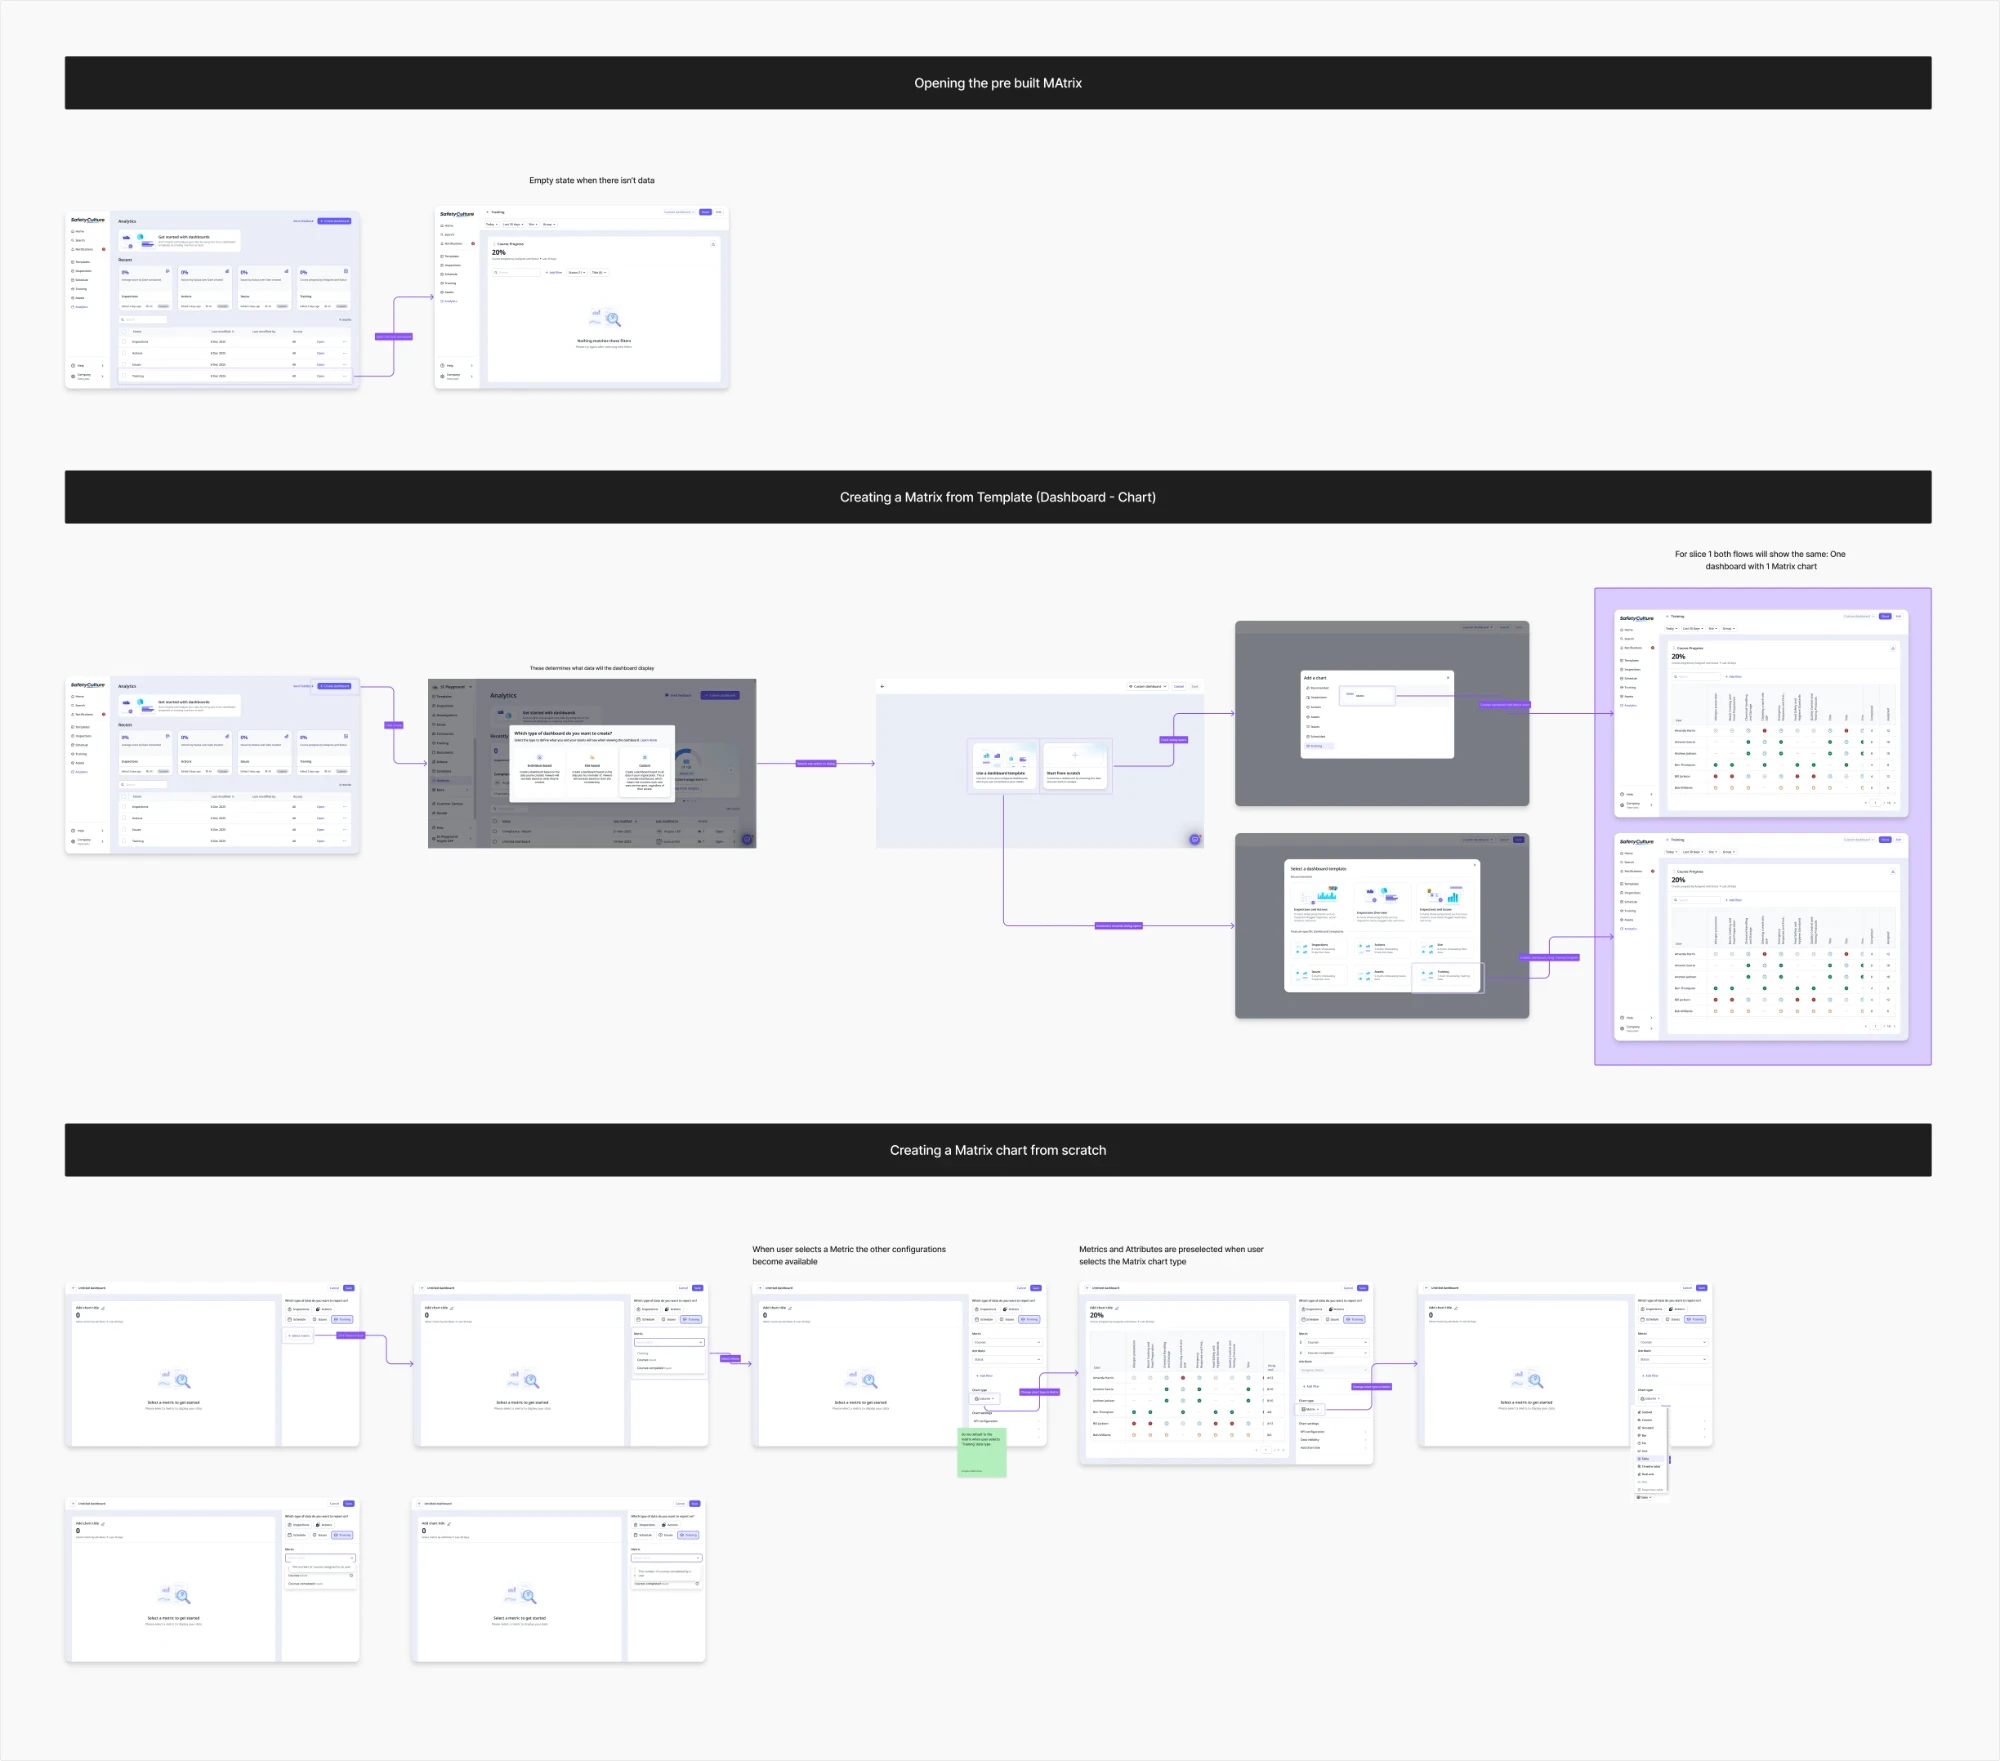
When it’s time to roster, the manager opens the Training dashboard, filters to their team and scans for anyone not started, due soon or overdue. An admin adds the same matrix to any dashboard, as a chart or from a template.
06Outcome
Around 600 people a week now check who’s ready to work.
Checking who’s ready has become part of the weekly routine. Weekly viewers of the training matrix have roughly doubled, from 300–400 in 2025 to 600–660 in recent weeks, and 75 to 85 people export a report from it every week. Credentials tell the same story. Between 4,100 and 4,500 people a month use the credentials matrix, adding more than 19,000 credentials in a typical 30 days. Adding is the most common action, followed by renewing and editing: the steady upkeep that stops a licence quietly expiring before someone is rostered on. Before release, we tested whether managers understood the matrix in its new home in Analytics.
- 600+
- Weekly viewers of the training matrix, up from 300–400 in 2025
- ~80
- People exporting a matrix report every week
- 4,100+
- Monthly active users in the credentials matrix
- 19,000+
- Credentials added every 30 days
Excludes internal staff. Weekly figures to November 2026; credential figures over a rolling month.